20210713 01 Flood: Unterschied zwischen den Versionen
Kaiko (Diskussion | Beiträge) |
Kaiko (Diskussion | Beiträge) |
||
| Zeile 128: | Zeile 128: | ||
| align = "left" width="100pt" | 12.11.2021 | | align = "left" width="100pt" | 12.11.2021 | ||
! scope="row" style="text-align:left" width="100pt" | Last Review | ! scope="row" style="text-align:left" width="100pt" | Last Review | ||
| align = "left" width="100pt" | | | align = "left" width="100pt" | 11.02.2023 | ||
! scope="row" style="text-align:left" width="135pt" | Documentation State | ! scope="row" style="text-align:left" width="135pt" | Documentation State | ||
| align="left" width="125pt" | <font color=orange>Ready for Review | | align="left" width="125pt" | <font color=orange>Ready for Review | ||
|} | |} | ||
Version vom 11. Februar 2023, 23:47 Uhr
Quick Facts
| Type of Event | Flood |
|---|---|
| Verification State | QC1 |
| ESWD | Not reported |
| Location | Vierwaldstättersee, Thunersee, Bielersee, Neuenburgersee, |
| Time / Duration | several days |
| Date | 13. - 19.07.2021 |
| Magnitude / Dimension |
- |
| Damage | - |
| Fatalities | - |
| Injuries | - |
| Report Source | Newspaper report, Data from weather / hydro stations |
| Remarks | - |
Ereignis
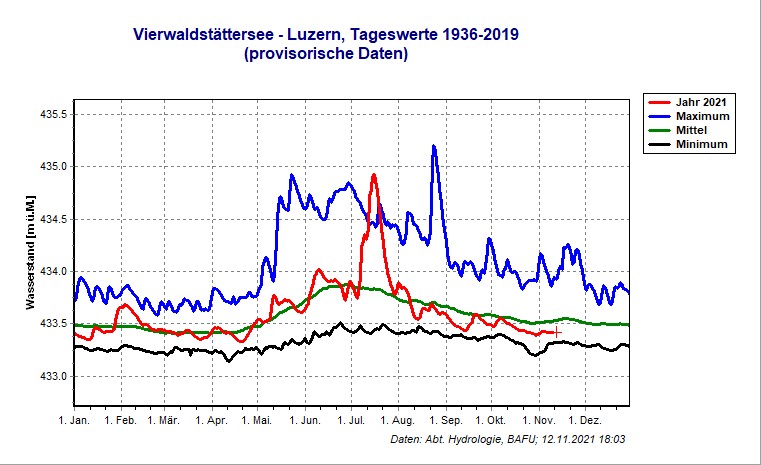
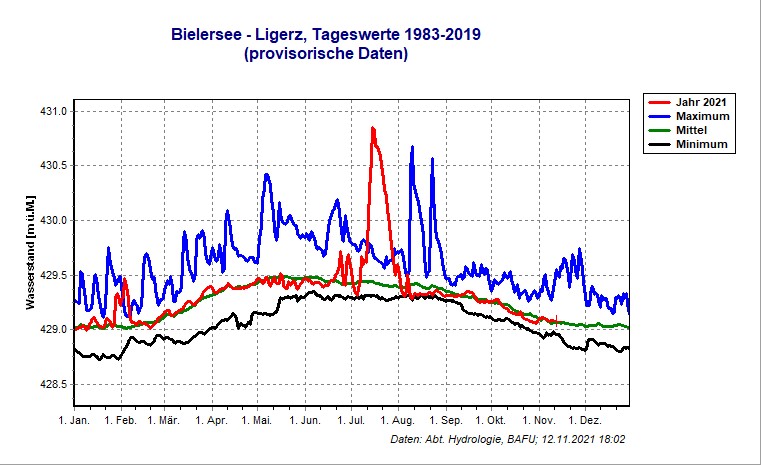
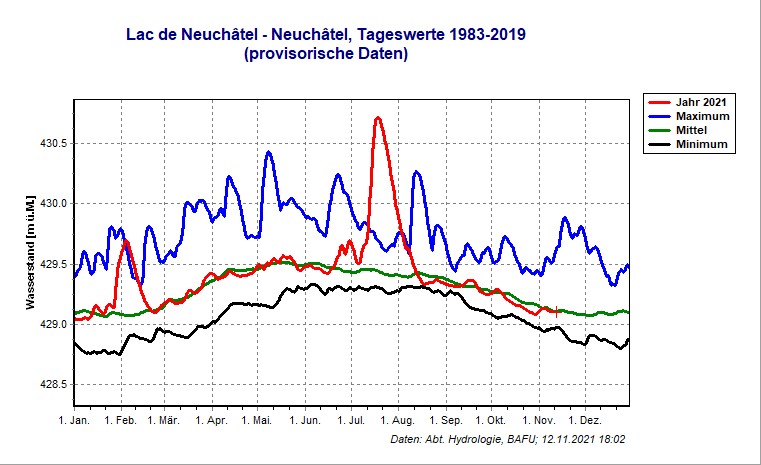
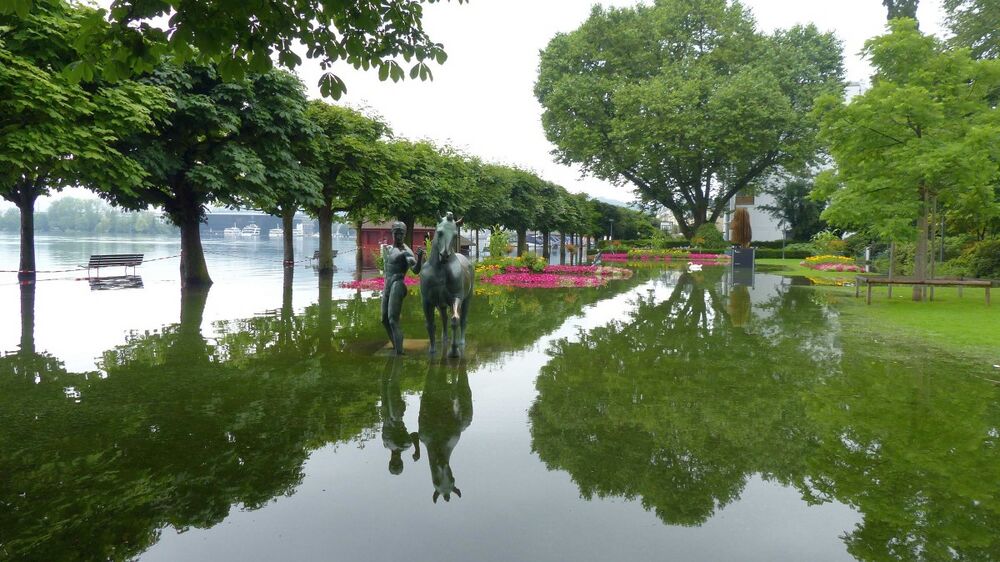
Ausgiebige Regenfälle führten Mitte Juli 2021 zu Hochwasser am Vierwaldstättersee, Thunersee, Bielersee, Neuenburgersee, Zürichsee u.a.
Diverse Flüsse im Mittelland führten Hochwasser.
Abflussspitzen
Maximale Abflüsse: (mit Gefahrenstufe)
GS4 | 535 m3/s Limmat - Zürich (13.07.2021) >> Jahreshochwasser | Statistik | Standortkarte
GS4 | 552 m3/s Limmat - Baden (15.07.2021) >> Jahreshochwasser | Statistik | Standortkarte
GS4 | 225 m3/s Reuss - Andermatt (13.07.2021) >> Jahreshochwasser | Statistik | Standortkarte
GS3 | 526 m3/s Reuss - Seedorf (13.07.2021) >> Jahreshochwasser | Statistik | Standortkarte
GS5 | 480 m3/s Reuss - Luzern (16.07.2021) >> Jahreshochwasser | Statistik | Standortkarte | > Rekordabfluss
GS3 | 689 m3/s Reuss - Mühlau (13.07.2021) >> Jahreshochwasser | Statistik | Standortkarte
GS4 | 752 m3/s Reuss - Mellingen (14.07.2021) >> Jahreshochwasser | Statistik | Standortkarte
GS5 | 500 m3/s Aare - Thun (16.07.2021) >> Jahreshochwasser | Statistik | Standortkarte
GS5 | 562 m3/s Aare - Bern, Schönau (16.07.2021) >> Jahreshochwasser | Statistik | Standortkarte
GS3 | 1'044 m3/s Aare - Hagneck (16.07.2021) >> Jahreshochwasser | Statistik | Standortkarte
GS5 | 765 m3/s Aare - Brügg, Aegerten (25.07.2021) >> Jahreshochwasser | Statistik | Standortkarte
GS3 | 1'021 m3/s Aare - Murgenthal (15.07.2021) >> Jahreshochwasser | Statistik | Standortkarte
GS3 | 1'165 m3/s Aare - Brugg (15.07.2021) >> Jahreshochwasser | Statistik | Standortkarte
GS3 | 2'201 m3/s Aare - Untersiggenthal, Stilli (14.07.2021) >> Jahreshochwasser | Statistik | Standortkarte
GS3 | 3'504 m3/s Rhein - Rheinfelden (16.07.2021) >> Jahreshochwasser | Statistik | Standortkarte
GS4 | 3'729 m3/s Rhein - Basel (15.07.2021) >> Jahreshochwasser | Statistik | Standortkarte
GS3 | 510 m3/s Sarine - Fribourg (13.07.2021) >> Jahreshochwasser | Statistik | Standortkarte
GS3 | 668 m3/s Saane - Laupen (13.07.2021) >> Jahreshochwasser | Statistik | Standortkarte
GS3 | 248 m3/s Sihl - Zürich, Sihlhölzli (13.07.2021) >> Jahreshochwasser | Statistik | Standortkarte
GS3 | 117 m3/s Ergolz - Liestal (13.07.2021) >> Jahreshochwasser | Statistik | Standortkarte
Maximaler Wasserstand Seen:
Station Vierwaldstättersee - Luzern / 434.95 müM

© Bafu
Station Thunersee - Spiez, Kraftwerk BKW / 558.75 müM

© Bafu
Station Bielersee - Ligerz, Klein Twann / 430.94 müM

© Bafu
Station Lac de Neuchâtel - Neuchâtel, Nid-du-Crô / 430.72 müM

© Bafu
Station Zürichsee-Zürich, Zürichhorn / 406.73 müM
© Bafu
Bilder
Bilder aus Luzern

© Hans-Jörg Stöckli
Messdaten
Videos
Videos vom Vierwaldstättersee
© Hans-Jörg Stöckli
© Daniel Blättler
© Tele1AG
Medienlinks
Diskussion im Sturmforum Schweiz:
FCST/NCST Gewitter/Hochwasser ab 12.07.2021
Interna
| SSWD Main Editor | Kaiko | Last Edit | 12.11.2021 | Last Review | 11.02.2023 | Documentation State | Ready for Review |
|---|
